Get a Clear View of Your E-Commerce Performance
We bring your seller data together to understand where sales are coming from, where money is going and where performance can be improved.
Sales Analysis
Analyze orders, revenue, sales trends, marketplace performance and product-level sales.
Return Analysis
Identify products and patterns with higher returns and investigate possible reasons behind them.
Advertising Analysis
Compare advertising spend with sales and evaluate whether promoted products are generating profit.
Payment & Settlement Analysis
Analyze order-level payments, settlements, fees, deductions and received amounts.
Profit & Loss Analysis
Understand product and order profitability after relevant costs, fees, returns and advertising.
Product / SKU Analysis
Find high-performing, low-performing and problematic products using SKU-level data.
From Seller Portal Data to Business Insights
We structure, clean and analyze your seller data using multiple analytical tools to create a clear view of business performance.
Seller Portal Data
Collect relevant business data such as sales, returns, advertising and payments from the seller platform.
SQL Data Processing
Clean, organize and process the raw data to create a structured and reliable master dataset.
Unified Business Data
Combine the required information into a master dataset for consistent analysis and reporting.
Pivot Analysis & Dashboard
Analyze the processed data using Pivot Tables, reports and dashboards.
Interactive Visualization
Build interactive dashboards to make business performance easier to understand.
Statistics & Prediction
Apply statistical analysis and predictive techniques to identify trends and future possibilities.
Find the Real Problems
Connect sales, returns, ads, payments and profitability to identify important business issues.
Recommendations
Convert findings into practical recommendations that can support better business decisions.
Amazon Seller Business Analysis Project
An end-to-end e-commerce analysis project demonstrating how seller data can be processed, analyzed and converted into dashboards, statistical insights and business intelligence.
Amazon Seller Sales Performance Analysis
The project starts with business data and follows a structured analysis process using SQL, Excel, Power BI, Tableau and Python to understand business performance and generate actionable insights.
Project Documentation & Proof
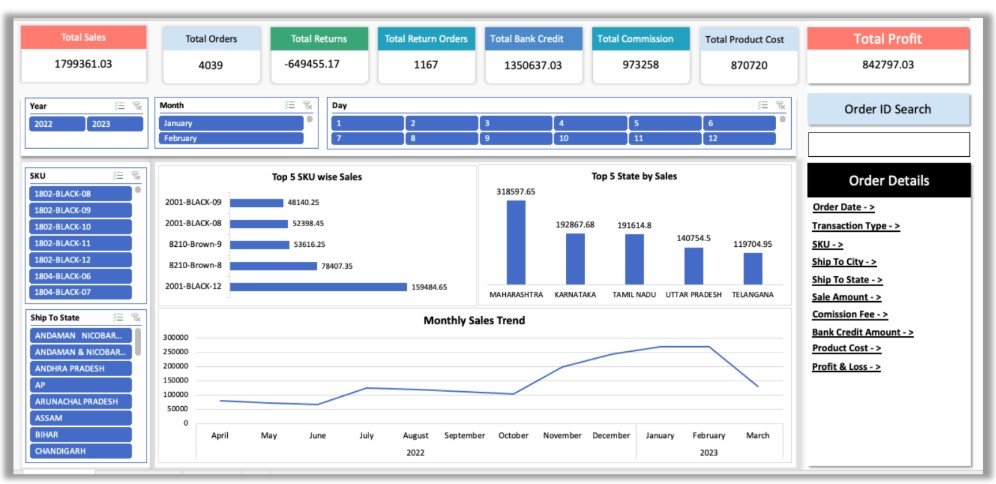
Amazon Seller Performance Dashboard
Raw Seller Data → Data Cleaning → Master Dataset → Business Analysis → Excel / BI Dashboards → Statistical Analysis → Prediction → Business Insights.
Find Out What Is Really Happening in Your Seller Business
Instead of only showing numbers, we connect different parts of your seller data to identify the reasons behind performance issues and opportunities.
Why Are Returns Increasing?
Identify products, SKUs and return patterns with unusually high return rates and investigate the available return data.
→ Return Pattern & Product AnalysisIs the Order Actually Profitable?
Compare sales revenue with product cost, marketplace charges, shipping, returns and other available costs.
→ Order & Product ProfitabilityAre Ads Generating Profit or Loss?
Connect advertising spend with sales and product profitability to understand the business impact of paid campaigns.
→ Ad Spend & Profitability AnalysisWhere Is the Money Going?
Analyze payments, settlements, marketplace fees, deductions and available transaction-level data.
→ Payment & Settlement AnalysisWhich Products Need Attention?
Identify products that are driving sales, generating low returns, creating losses or showing performance issues.
→ Product / SKU Performance AnalysisWhat Could Happen Next?
Use historical data and statistical analysis to identify trends and generate predictive insights where the available data supports it.
→ Statistics & Predictive Analysis